
Your live stream can show 10,000 views while only 12 people are watching right now. Nothing is necessarily broken, and neither number has to be fake. The two counters answer different questions over different time windows.
This guide puts concurrent viewers vs views into one mental model. You will learn what each number measures, how the numbers connect through watch time, and how to turn the graph into scheduling and sponsor decisions without inflating your audience.
The three numbers on the same stream
Imagine a railway platform. People arrive, stay for a while, and leave. A headcount taken at 8:15 p.m. is concurrent viewership. The busiest headcount all day is peak concurrent viewership. The turnstile count keeps accumulating every arrival.
- Concurrent viewers: the number of people watching simultaneously at a particular moment. It changes as viewers join and leave. This is the best answer to “How many are here now?”
- Peak concurrent viewers: the maximum simultaneous audience reached during the stream. A short raid, notification wave, festival moment, or featured segment can create the peak, so it does not describe the whole broadcast.
- Views: the total number of times the live stream was viewed while live. YouTube also uses “playbacks” in its mobile post-stream documentation, defining them as the number of times a browser or device started playing the stream. A repeat visit can contribute another playback; views are not the same as unique people.
Those definitions come from YouTube’s current live-stream metrics documentation. In broader Analytics reports, YouTube describes views as legitimate views, while unique viewers is a separate estimated audience measure. That distinction matters: never translate 10,000 views into “10,000 people.”
Average concurrent viewers is also useful. It averages the simultaneous audience across the selected stream or reporting window. Peak tells you the high-water mark; average tells you what the room usually felt like.
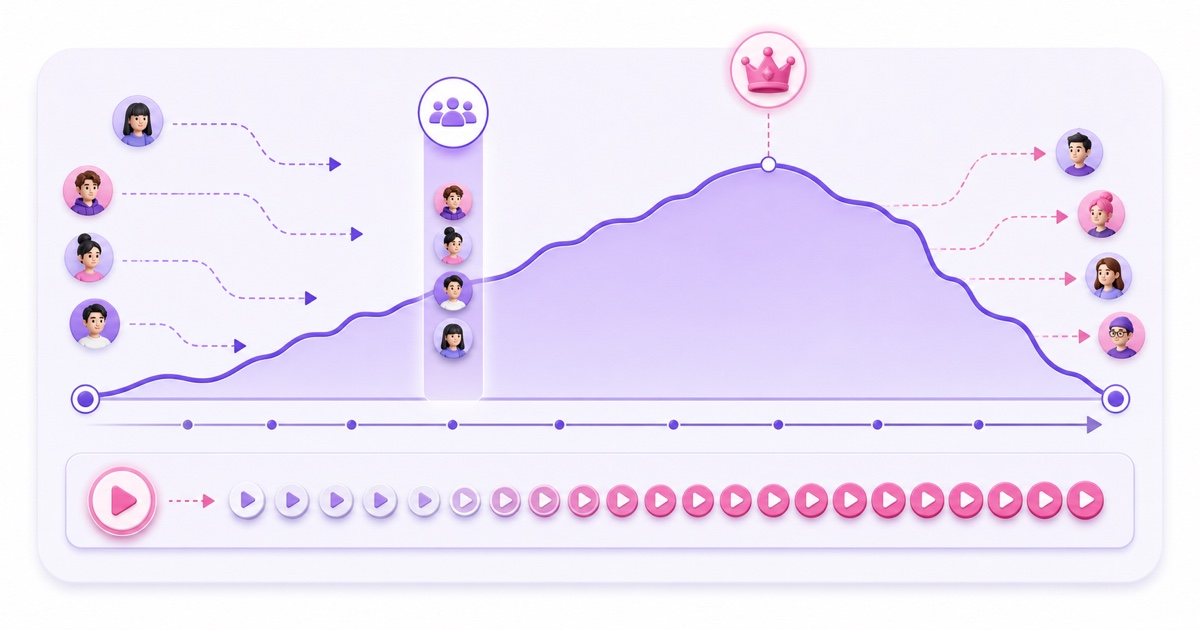
The short version: concurrency is a snapshot, peak is a record, and views are a running total. One stream can truthfully have a small snapshot and a large total.
Why loops make views balloon
A normal one-hour live event has a limited window in which people can enter. An always-on stream has hundreds of hours. Search, suggested videos, subscriber notifications, links, and returning viewers can keep sending small waves of arrivals long after launch.
Here is an illustrative example, not a benchmark. Suppose an ambience stream runs for 30 days, or 720 hours. It averages 12 concurrent viewers throughout that period:
- 12 average concurrent viewers × 720 live hours = about 8,640 watch hours.
- The stream records 10,000 playback starts across the month, or roughly 333 per day.
- To produce about 8,640 watch hours from those starts, the average viewing session would be roughly 52 minutes: 10,000 × 52 ÷ 60 = about 8,667 hours.
That combination is perfectly coherent. Thousands of people can drop in across a month while only a dozen are present at an average instant. Some stay two minutes, some stay through an entire bhajan set or focus block, and returning viewers may create additional starts.
The equations connect the same attention from two directions:
Average CCV × live hours ≈ total watch hours.
Views × average view duration ÷ 60 ≈ total watch hours.
Small differences are normal because dashboard metrics can be estimated, processed, and filtered at different stages. The purpose of the arithmetic is not to reverse-engineer YouTube’s counters to the last digit. It is to catch impossible claims and explain the scale honestly.
For a sponsor, say “10,000 views during the 30-day window, with 12 average concurrent viewers.” Do not say “10,000 viewers were watching.” The first statement is precise; the second merges a cumulative count with a simultaneous audience.
The metric that pays the bills
Views measure arrivals. Watch time measures attention delivered. If someone starts the stream and leaves after ten seconds, that start and a two-hour listening session should not carry the same meaning when you evaluate the content.
For public long-form content, valid public watch hours also matter for YouTube Partner Program eligibility. YouTube’s current YPP eligibility guide says watch hours from unlisted or deleted livestreams, and livestreams not converted to video on demand, do not count toward the public-watch-hour threshold. See the complete 24/7 stream watch-hours math before treating every hour in Analytics as an eligible YPP hour.
Watch time is not automatically revenue, and hitting a watch-hour threshold does not guarantee approval. Policy review, audience geography, monetization status, advertiser demand, and the content itself remain separate questions. Still, watch time is the cleanest bridge between concurrency and cumulative views because it records how long the audience actually stayed.
Use three checks together:
- Views tell you whether people entered.
- Average view duration tells you how long a typical view lasted.
- Average concurrency and watch time tell you how much sustained attention existed across the broadcast.
A large view total with weak duration may indicate many brief visits. A modest view total with strong duration can support a stable concurrent audience. Neither pattern proves what YouTube’s live recommendation system will do next; Analytics shows outcomes, not secret ranking weights.
Where each number lives in Analytics
While you are live, open YouTube Studio → Go Live → Stream and use Live Control Room. Its real-time analytics show concurrent viewers, peak concurrent viewers, duration, views, average view duration, likes, and chat rate for the active stream. Use this surface for operational decisions: whether a scheduled host should join, whether a content change landed, or whether an unexpected spike deserves attention.
After a stream ends, open YouTube Studio → Content → Live → select Analytics on the stream → Engagement. That video-level report includes the concurrent-viewers curve. YouTube says these metrics are available within minutes after the stream ends, and its live-metrics guide explains that Analytics data is processed and despammed and measures different information from Live Control Room.
That is why a live card, the public watch page, and a processed report may not match at the same moment. Treat them as different stages, not as three competing truths:
- During the stream: use Live Control Room as a directional, real-time instrument.
- Minutes after the stream ends: use the post-stream snapshot for an initial review.
- For reporting: use the processed Analytics report, a fixed date range, and a saved export or screenshot.
YouTube does not publish one universal promise that every live metric “settles” after exactly 24 or 48 hours. The official commitment is narrower: video-level live metrics become available within minutes after the stream ends. Special formats can have their own timing; for example, YouTube documents a 24-hour wait to separate vertical-feed metrics from a dual horizontal-and-vertical stream.
For an always-on stream that has not ended, there is no post-stream boundary yet. Read live data for operations, capture snapshots at consistent times, and avoid sending a sponsor a number copied during a spike. When a planned stream boundary occurs, use the processed report for the completed period.
Reading your daypart curve
Your own concurrent-viewer curve can answer a more valuable question than “Is 12 CCV good?” It can show when your specific audience chooses to be present. An India-first devotional channel may rise around morning and evening routines. A focus stream with viewers in North America may peak during US work hours, even when that means late night in IST. These are hypotheses to test, not universal schedules.
Build a simple daypart review:
- Choose a clean window. Use the last completed seven days, and keep the timezone fixed. Label it clearly as IST, UTC, or the audience timezone.
- Read the curve by hour. Export the concurrent-viewer data when available, or record consistent hourly snapshots for a stream that remains live. Use average or median readings rather than selecting only the best minute.
- Overlay your programming. Mark when each bhajan set, lo-fi playlist, lesson, or host segment ran. A peak without the content schedule beside it is only half an answer.
- Separate repeatable patterns from events. A festival, shout-out, or external share can create a one-day spike. Look for a shape that repeats on comparable days.
- Change one thing. Move one content refresh, community post, or host-presence window. Keep the rest stable long enough to judge the result.
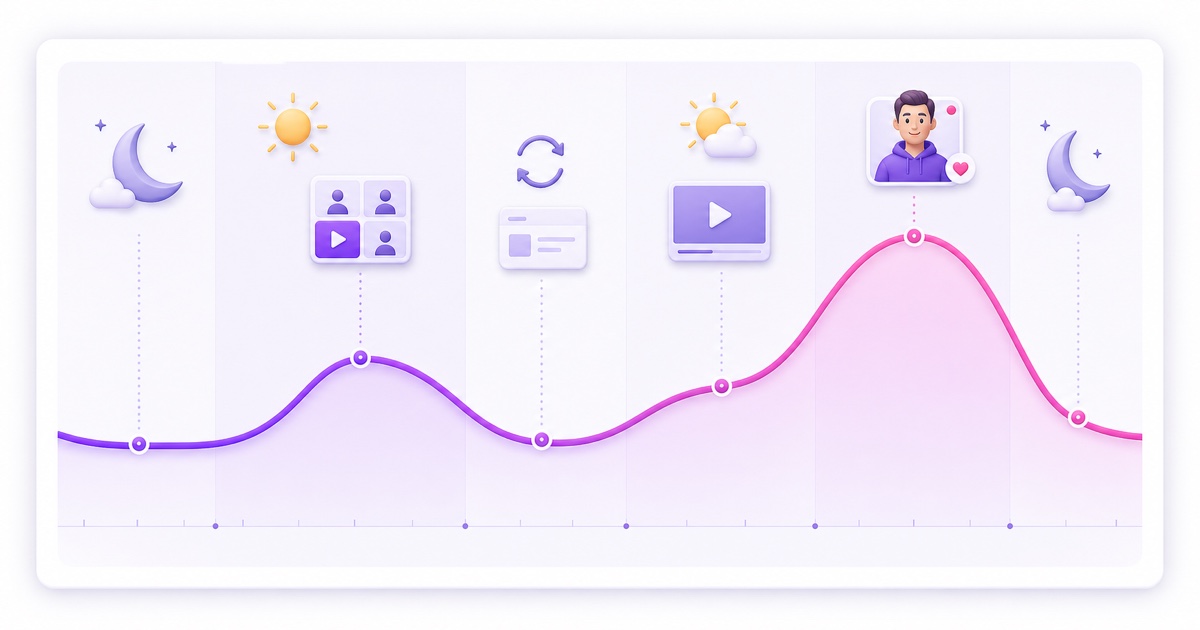
Illustrative curve only: the image above is not a promised YouTube benchmark. Your useful curve is the one produced by your viewers. If evenings repeatedly hold more people, schedule the strongest segment shortly before that rise so early arrivals have something worth staying for.
Presence also matters differently from playback. Use proven high-attendance windows for chat, moderation, and the community actions described in the always-on Super Chat and memberships guide. Put routine library swaps in quieter windows when a brief disruption would affect fewer viewers.
Run the same review for four weeks before making a larger capacity decision. A single peak is excitement; a repeatable curve is evidence. If you are considering another stream, feed this evidence into the second-slot readiness test instead of scaling from a screenshot.
Benchmarks and honest sponsor reporting
There is no universal “good CCV.” Twelve concurrent viewers can be meaningful for a narrow B2B stream and disappointing for a large entertainment channel. Niche, stream age, traffic source, geography, content length, and channel size all change the context.
Use your own trailing four weeks as the first benchmark. Compare each completed week against the previous four-week median, then annotate material changes such as a new thumbnail, schedule, playlist, promotion, or festival. This creates a baseline you can act on without borrowing someone else’s highlight reel.
| Metric | What it means | How to report it |
|---|---|---|
| Average concurrent viewers | Typical simultaneous audience across the selected window | Include the exact date range and timezone |
| Peak concurrent viewers | Highest simultaneous audience at one moment | Include the peak time and note any special event |
| Views | Legitimate cumulative views during the window | Never relabel this as unique people or CCV |
| Watch time | Total hours the content was watched | State whether this is Analytics watch time or valid public YPP hours |
| Average view duration | Estimated minutes watched per view | Use it to explain how arrivals became attention |
A clean sponsor note might read: “Reporting window: 1–30 June, IST. The stream averaged 12 concurrent viewers, peaked at 38, recorded 10,000 views, and generated 8,640 watch hours.” If those numbers are hypothetical, label them hypothetical. If they are real, attach the Analytics export and disclose paid promotion or exceptional traffic.
Report average CCV, peak CCV, and watch hours together because each closes a loophole in the others. Peak without average can exaggerate a brief moment. Views without concurrency can sound like a simultaneous crowd. Watch hours without the reporting period hides how long the stream ran.
The honest conclusion is simple: views tell you how many validated viewing events accumulated, concurrency tells you who was present together, and watch time connects the two. Read all three on the same date range, then make one decision your next report can test.
Ready to run your pre-recorded programming around the clock? Start free — 24-hour trial, no card.
FAQ
Why does my stream have 10,000 views but only 12 watching?
Views accumulate as people start and revisit the stream across its lifetime. Twelve watching is a simultaneous snapshot; 10,000 views is a cumulative count. Both can be true, especially on a stream that has run for days or weeks.
Which metric matters for monetization?
Watch time best reflects attention, and valid public watch hours contribute to relevant YPP eligibility paths. However, only qualifying public watch hours count; YPP approval and actual revenue also depend on policy compliance, monetization eligibility, audience, and advertiser demand.
When do live analytics settle?
YouTube says video-level live metrics are available in Analytics within minutes after a stream ends, but it does not promise one universal finalization time for every metric and format. Use Live Control Room for direction during the broadcast, then use the processed post-stream report and a fixed date range for formal reporting.