
Ask how much YouTube pays for live streams and you will usually get a confident number with no channel, country, season, or revenue mix attached.That number is not a benchmark.It is one creator's outcome stripped of the variables that made it happen.
A 24/7 stream can generate ad revenue, but being live around the clock does not create a fixed rate.This guide gives you the arithmetic, shows where to find the inputs, and explains why niche matters without inventing an RPM table.There are no earnings promises here.
Why nobody can tell you your number
Two channels can run equally long streams and produce very different revenue.One may reach business viewers in a competitive advertising market; another may play sleep sounds to a mostly non-commercial audience.One may have memberships and YouTube Premium revenue inside its RPM, while the other relies only on ads.
Even the same channel can move from one period to the next because its viewer geography, traffic sources, ad availability, and revenue mix changed.That is why a listicle's “live-stream RPM” cannot answer the question for your channel.
What you can compute is a scenario.Take an RPM from your own YouTube Analytics, multiply it by the relevant views, and treat the result as arithmetic for that set of assumptions.If you are not monetised yet, build a range of scenarios for planning, but do not call any of them a forecast.
CPM vs RPM, cleared up properly
CPM is advertiser-side: the cost an advertiser pays for 1,000 ad impressions, before YouTube's revenue share.Playback-based CPM is the advertiser cost for 1,000 video playbacks in which at least one ad appeared.A monetised playback can contain more than one ad impression, so those two CPM measures are not interchangeable.
RPM is creator-side: your total YouTube revenue per 1,000 views after YouTube's revenue share.YouTube says this metric can include ads, YouTube Premium, channel memberships, Super Chat, and Super Stickers.It also includes views that did not show an ad, which is one reason RPM is normally lower than the CPM figures people post online.These definitions were checked against YouTube's ad-revenue analytics documentation in July 2026.
| Metric | Whose perspective? | Denominator | What it tells you |
|---|---|---|---|
| CPM | Advertiser | 1,000 ad impressions | Advertiser spend before revenue share |
| Playback-based CPM | Advertiser | 1,000 playbacks with one or more ads | Advertiser spend on monetised playbacks |
| RPM | Creator | 1,000 total views | Your reported YouTube revenue after revenue share |
The common mistake is comparing your RPM with another creator's CPM and concluding that YouTube kept the difference.The denominators and included revenue are different, so the comparison cannot support that conclusion.
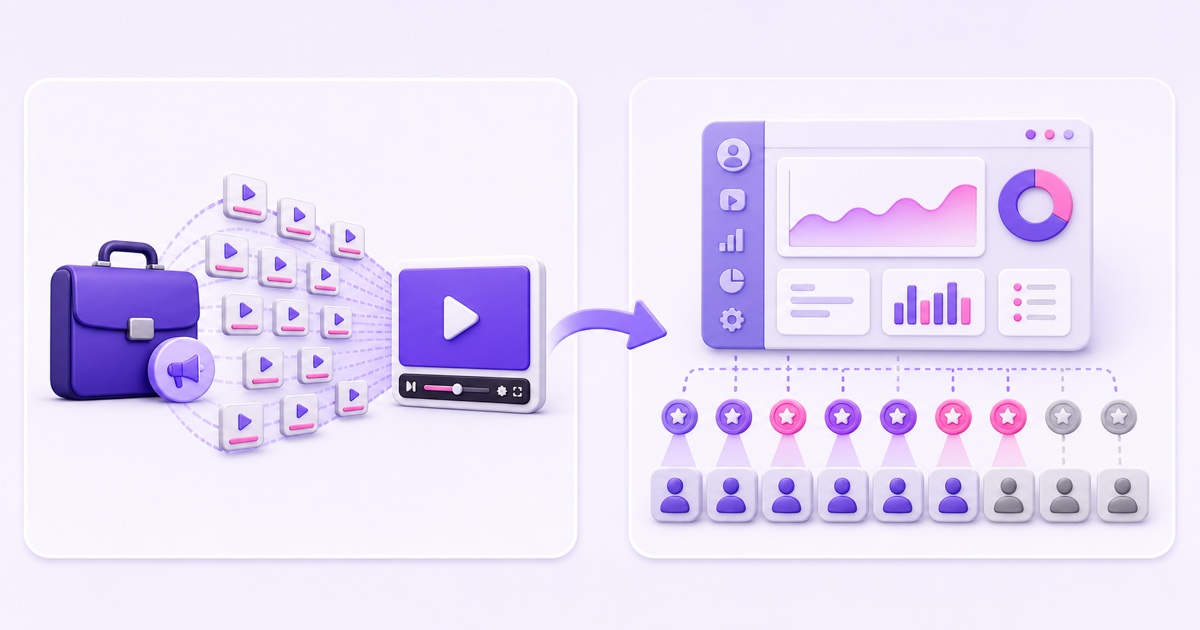
The formula, with every assumption labelled
Because YouTube defines RPM across all views, the clean formula is:
Estimated YouTube revenue for a selected period = (total views in that period ÷ 1,000) × RPM
Do not substitute estimated monetised playbacks for total views in that formula.Doing so mixes a playback-based advertising measure with a creator RPM whose denominator already includes monetised and unmonetised views.
Here are two deliberately artificial examples.Every input is an assumption, neither RPM is a niche benchmark, and neither result predicts a channel's future.
| Input | Example A | Example B |
|---|---|---|
| Selected period | Assumption: one chosen Analytics date range | Assumption: one chosen Analytics date range |
| Total views | Assumption: 40,000 | Assumption: 25,000 |
| RPM | Assumption: ₹60 | Assumption: $2.40 |
| Arithmetic | 40,000 ÷ 1,000 × ₹60 | 25,000 ÷ 1,000 × $2.40 |
| Calculated result | ₹2,400 for that assumed period | $60 for that assumed period |
The table is useful only as a calculator demonstration.Replace both inputs with your actual Analytics values before making a decision.If you want to model ad revenue alone, use estimated ad revenue and estimated monetised playbacks as a separate analysis rather than pretending total RPM is an ad-only metric.
Why live is different from uploads
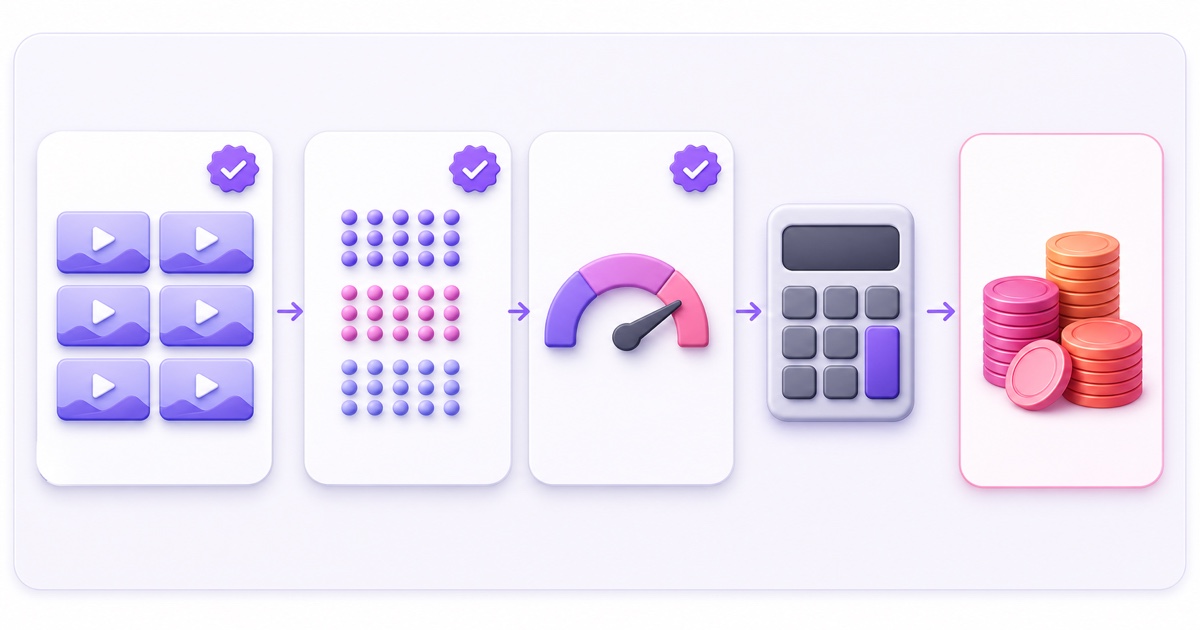
A long live session creates more opportunities for an eligible viewer to encounter an ad, but an opportunity is not an impression.YouTube states that ad serving on live streams is not guaranteed and that some viewers may receive no ad.Geography, available inventory, targeting, Premium status, recent ad exposure, and advertiser suitability can all affect delivery.
Live ad controls are their own system
For a monetised live stream, pre-roll ads can run before viewing.Mid-rolls can be inserted automatically or manually from YouTube Studio's Live Control Room; current automatic controls include frequency choices, while eligible configurations can also use scheduled breaks.The current path is YouTube Studio → Create → Go live → Stream or Manage → Edit → Monetization.
YouTube's live monetisation guide also makes an important point: viewers do not necessarily see a mid-roll at the same time, and a viewer who receives no ad simply continues watching.Read the full live ad eligibility and placement guide before changing ad frequency on an unattended loop.
Views and concurrent viewers answer different questions
In Live Control Room, “views” means the total times the stream was viewed while live.“Concurrent viewers” is the number watching at the same moment, and peak concurrent is the highest simultaneous count.YouTube Analytics can sort performance as Live, On demand, or Live & on demand, and YouTube provides a Live filter for revenue from streams and live replays.
That means 100 people watching together is not the same metric as 100 accumulated views, and neither number tells you how many ads ran.Use the definitions in YouTube's live-metrics documentation, then see our guide to concurrent viewers versus views.Upload RPM benchmarks do not transfer neatly because live sessions have different ad opportunities, viewing patterns, and live-versus-replay reporting.
The variables that dominate everything else
- Audience geography and advertiser demand. Advertisers choose where they want to compete, and YouTube explicitly lists geography as a reason CPM changes.The viewer's location matters more than the creator's location.
- Niche and commercial intent. A business-software audience may attract advertisers selling high-consideration products.Ambience, music, or devotional viewing often has weaker purchase intent, but no niche has a guaranteed rate.
- Monetisation and audience classification. Content must remain eligible and advertiser-friendly.For content set as made for kids, personalised ads, remarketing, and personalised targeting are prohibited; contextual ads may still run.Check YouTube's made-for-kids advertising rules rather than assuming every family-friendly loop is child-directed.
- Season. Advertiser competition changes through the year.A period with higher bidding does not establish a permanent channel RPM.
- Watch context and ad delivery. Device, session length, ad inventory, Premium viewing, and recent ad exposure affect whether an ad opportunity becomes an impression.More hours live do not guarantee proportionally more ads.
- Revenue mix. A membership or Super can raise YouTube-reported RPM even when ad performance is flat.Look at the source breakdown before attributing an RPM change to ads.
Rank these using your data, not a generic niche chart.Geography can dominate one channel while memberships dominate another.
Where to get real numbers
Open YouTube Studio → Analytics → Revenue.Set a date range that reflects the decision you are making, then record RPM, playback-based CPM, estimated monetised playbacks, estimated ad revenue, and total estimated revenue.Use the Content or Advanced mode filters to isolate the relevant live stream and compare Live, On demand, and Live & on demand where the report supports it.
- Start with the stream's total views and RPM for the same date range.
- Check estimated ad revenue separately so memberships or Supers do not masquerade as ad improvement.
- Compare top geographies and traffic sources between periods.
- Annotate any policy, ad-setting, or content change that happened during the comparison.
- Repeat across several comparable periods before treating a movement as a pattern.
For the wider eligibility context, read whether a 24/7 loop can be monetised and how watch hours work on an always-on stream.Watch time is not the same as revenue.
If you are not monetised yet
You do not have an authoritative RPM for your channel.Ask a creator serving the same niche, language, and viewer geography to share a range privately, then label it as somebody else's history.Build low, middle, and high scenarios, but make the launch decision on content demand and manageable cost rather than the most attractive cell in a spreadsheet.
The India reality
For an India-heavy devotional, ambience, lofi, or regional-language channel, large watch time can coexist with modest ad revenue.That pattern is driven by the audience's advertiser market and the content's commercial intent, not by Hindi, Tamil, Telugu, bhajan, or meditation content being assigned a fixed “India RPM.”
A mobile-first audience may also have different devices, session habits, and ad exposure from the audience behind an overseas benchmark.The practical response is not to invent a better rate.Segment Analytics by geography, observe which revenue sources actually contribute, and decide whether the channel still makes sense at the low end of your own scenarios.
The running cost is knowable while revenue is not.StreamNeo currently lists ₹49/day or ₹999/month in India and $9.99/month internationally; confirm the current plan on the pricing page, then size the experiment so the cost remains comfortable even if ads disappoint.
Revenue that does not depend on the ad auction
Ad RPM is only one path.Some alternatives still appear inside YouTube's total RPM, while others sit outside it entirely:
- Memberships and fan support: these can raise reported RPM, but they depend on trust and community rather than advertiser bidding.An unattended loop is a weak place for spontaneous support unless viewers already value the channel.See the practical guide to memberships and Supers on always-on streams.
- Affiliate links: a relevant recommendation can earn outside YouTube RPM, but only with clear disclosure and real audience fit.Random links under a sleep stream are not a strategy.
- Sponsorships: a niche sponsor may value consistent exposure or a defined community.Price and disclose the placement honestly; do not promise viewer actions you cannot measure.
- Your own product or service: a class, consultation, app, local service, catalogue, or WhatsApp enquiry can make the stream a discovery surface rather than the product itself.The always-on storefront playbook shows that model.
For many loop channels, these routes can matter more than ads because they connect a specific audience to a specific offer.The streaming tool does not create that fit; the content and offer do.
If a managed loop fits your test budget, Start free — 24-hour trial, no card.
FAQ
How much does a 24/7 live stream earn?
It depends on your total views, RPM, viewer geography, ad delivery, and non-ad revenue.Use total views ÷ 1,000 × your own RPM for a selected Analytics period; any single figure quoted online describes somebody else's channel and assumptions.
Why is my RPM lower than the CPMs I read about?
CPM reflects advertiser spend per 1,000 ad impressions before revenue share.RPM reflects your total YouTube revenue after revenue share per 1,000 views, including views with no ad, so the two figures use different denominators and should not match.
Do ambience and devotional loops earn less?
They often attract lower commercial intent than finance or business content, especially when most viewers are in less competitive ad markets, but there is no universal niche rate.Use your own geography and Revenue reports, then consider memberships, sponsors, affiliates, or your own offer instead of relying only on ads.